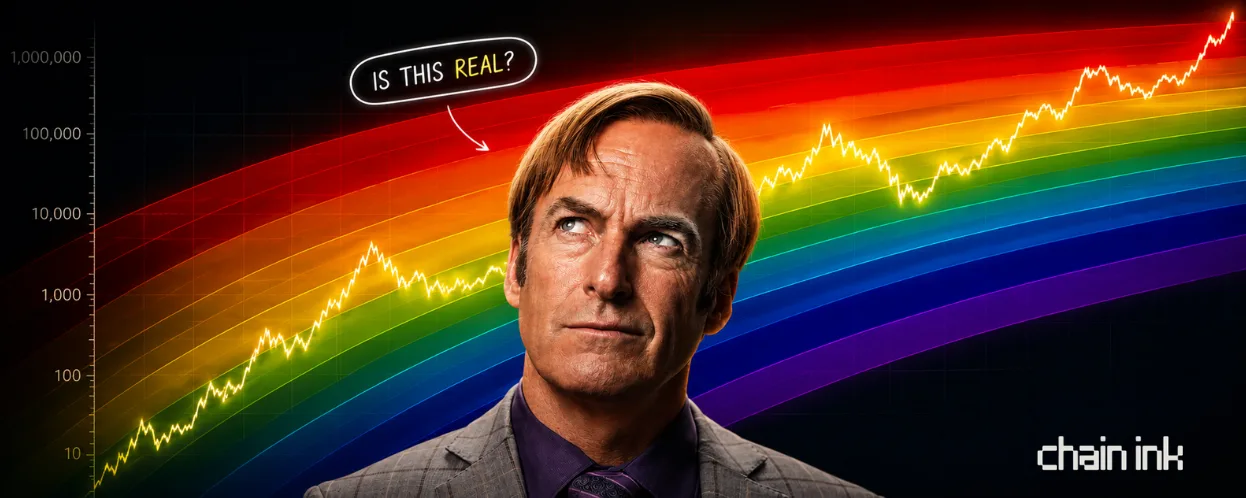
- the rainbow chart is a log-scale bitcoin chart with one fitted trend line and colored bands drawn above and below it.
- it started in 2014 on bitcointalk, after the mt. gox collapse, as a morale booster for a scared market.
- the price has always stayed inside the rainbow because the rainbow was drawn around the price. that's a fit, not a forecast.
- there are several versions, and the same price can land in different zones depending on which one you load.
- use it as a sentiment gauge for fear vs greed, never as a price target.
the mood ring
every few months it comes back around. a bitcoin price chart shaped like a rainbow, arcing up from left to right, the black price line riding through bands of color from deep blue at the bottom to angry red at the top. someone posts it, says we are in the "buy" zone, and a thousand people nod.
it is the most shared valuation tool in bitcoin. it is also barely a model. both of those things are true, and the gap between them is worth understanding before you let a rainbow tell you what to do with your money.
what it actually is
start with the shape, because the shape is doing a lot of quiet work.
bitcoin's price is plotted on a logarithmic scale, where each gridline is ten times the one below it. you need this, because bitcoin went from cents to tens of thousands, and on a normal linear chart the entire early history would be a flat line crushed against the bottom. log scale lets you see all of it at once.
through that history, someone fits a logarithmic regression curve. in plain terms, a smooth line drawn to follow bitcoin's long-term growth while ignoring the spikes and crashes. that line gets treated as "fair value," the trend bitcoin supposedly wants to return to.
then the rainbow. parallel colored bands are layered above and below that center line, each one a step further from the trend. cool colors below, warm colors above. wherever the price currently sits, the color of that band is supposed to tell you the market's mood. blue means cheap and hated. red means expensive and euphoric.
that is the whole machine. a trend line, and colored distance from it.
the colors
the labels are the fun part, and they tell you this thing was never meant to be solemn. from the bottom up: bitcoin is dead, basically a fire sale, buy, accumulate, still cheap, hodl, is this a bubble, fomo intensifies, sell seriously sell, and at the very top, maximum bubble territory.
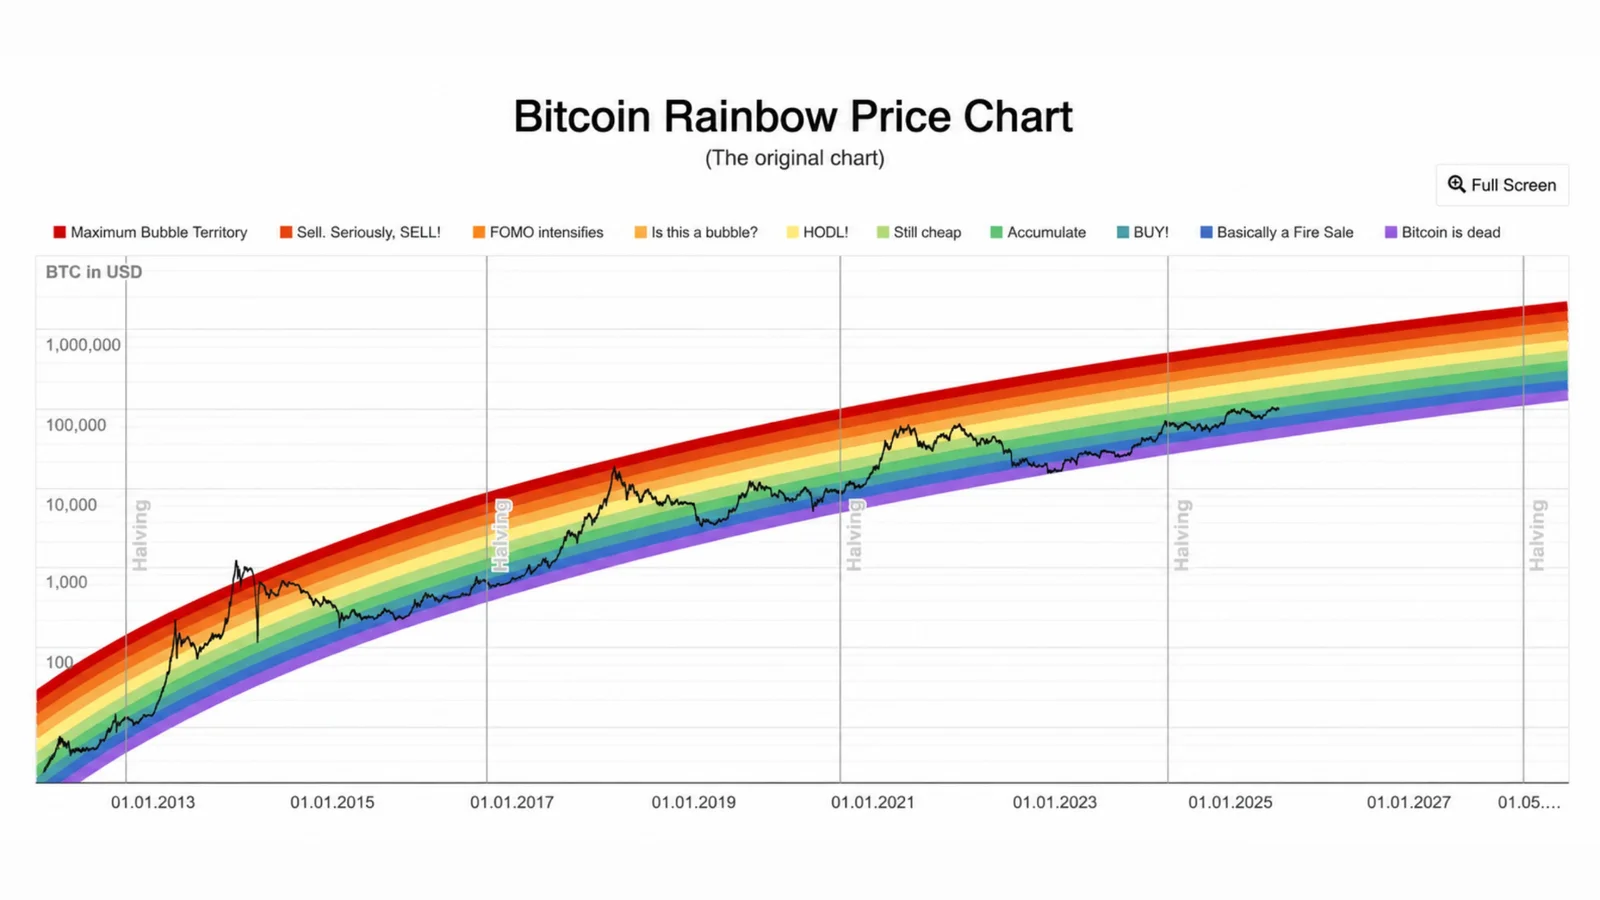
cool blues and greens at the bottom are the historically good places to have been buying. oranges and reds at the top are where people lost their minds. the chart is not shy about it. one of the band names is literally a panic.
where it came from
this is the part most people posting it do not know.
the rainbow started in 2014, in the wreckage of the mt. gox collapse, when bitcoin was a punchline and the mood was funereal. a user on the bitcointalk forum, posting as trolololo, drew the original logarithmic regression to argue that under all the despair, bitcoin was still tracking a long-term growth curve. the colored-band version came later and spread from there.
sit with that origin for a second. the rainbow chart was built as a morale booster, a way to tell terrified people in a bear market that the trend was still intact. it was half analysis and half therapy, and it has never fully stopped being either.
why people love it
to be fair, the appeal is real.
it filters out the noise. day to day, bitcoin is chaos, and the rainbow flattens that into a single calm question: are we hot or cold right now. it lines up loosely with the four-year halving rhythm, bottoms tending to form down in the blue and tops up in the red. and it is gloriously simple. no indicators to configure, no math to do. you glance, you see the color, you feel oriented.
for a beginner staring at a terrifying asset, that orientation is genuinely useful. it turns an unreadable chart into a feeling.
the catch
here is what the colors hide.
the rainbow is not a model of bitcoin. it is a line fitted to bitcoin's past, with bands drawn wide enough to contain that past. of course the price has always stayed inside the rainbow. the rainbow was drawn around the price. that is not a prediction coming true, it is a curve doing the one thing it was built to do.
there is no theory underneath it. nothing about supply, adoption, flows, or value. just "the line went up like this before, so assume it keeps going up like this." the bands quietly drift higher every year, because the model assumes bitcoin's logarithmic growth simply continues forever. feed it a future where that breaks and it has nothing to say, because it never knew why the line went up in the first place.
and then the tell. there is no single rainbow chart. there are several versions, fitted differently. load two of them on the same day and the same bitcoin price can land in completely different zones. one version can call it a clean buy while a stricter one says bitcoin is trading below its lowest band entirely. same asset, same price, same afternoon, two different moods. a model that cannot agree with itself is not a model. it is a vibe with axes.
how to actually use it
none of this makes it useless. it makes it a sentiment gauge, not a price oracle.
as a rough read on whether the market is fearful or greedy, the rainbow is fine, even helpful. cool colors have historically been better moments to accumulate than warm ones, and that is a real, if obvious, pattern. where it goes wrong is when people treat the bands as targets, as if red guarantees a top or blue guarantees a bottom. the bands have been broken before. each cycle, bitcoin has spent more time in the boring middle and reached the screaming extremes less often. the rainbow's wildest colors are slowly becoming places it no longer visits.
use it the way you would use a mood ring. fun, suggestive, occasionally right. never the thing you bet the house on.
the bottom line
the rainbow chart does not tell you where bitcoin is going. it tells you, in beautiful color, where bitcoin has already been, and quietly assumes the future will rhyme.
sometimes it does. sometimes the rhyme breaks, and the only people surprised are the ones who thought the colors were a forecast instead of a memory.
it is the most shared chart in bitcoin because it is the most comforting. just remember which of those two things it is actually optimized for.
the ink verdict
CHECKS OUT
cool bands have historically been better places to accumulate than warm ones, and the chart does flatten daily noise into one readable mood.
CAN'T VERIFY
that bitcoin's long-term log growth simply continues. the model has no theory underneath, so it can't tell you if that ever breaks.
WATCH
price spending time outside the bands, and the extreme colors getting visited less each cycle.
RECEIPTS
did this survive your dyor?
tap the heart to fill it with ink. up to 10 drops.

tanishq bodh
runs chain ink from a laptop with 40 tabs open. 39 are whitepapers, one is fpl.